Rogue waves are known as killer waves, and are thought to be just spontaneous large waves that happen in the deep sea. They can be as large as 90 feet but by definition are waves that are three times the average wave height at that particular sea state. They can be deadly even for the biggest ocean liners. They have been seen in the popular TV show, Deadliest Catch, and are known as one of the biggest threats while they are crab fishing. They seem to happen through a combination of high winds and fast currents.
Oceanography-David Faulkner
Sunday, December 5, 2010
Saturday, November 13, 2010
ESI Map
An ESI map is used to measure a coastal zone's natural resources and wildlife. They will show different habitats, and can be used to show how to prevent and respond to catastrophes such as oil spills. They use colors and symbols to identify the different zones and animals found on the map. They also show human-use resources such as marinas and swimming beaches.
Friday, October 22, 2010
Ice Caps, Glaciers, and Icebergs
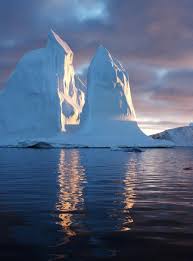
The North and South Poles are covered in ice that can be very thick. They never fully melt and refreeze every winter when they receive the fewest amount of sunlight. During the seasons of the fewest light the oceans will begin to freeze creating ice floes that can eventually turn into one big ice pack. Icebergs can break off the ice caps or glaciers to become small islands of ice that are big on the surface and even larger underneath the water. Underneath are pictures of the ice caps, icebergs, and a comparison of the ice cap from winter and summer. There is also a video link for a video showing an iceberg breaking apart.

North Ice Cap
North Ice Cap
South Ice Cap
Iceberg
Video of iceberg breaking into the ocean
Comparison of ice growth from winter to summer
Wednesday, October 20, 2010
Monday, September 27, 2010
Journal Articles
Red Tides
Red Tide is caused by dinoflagellates, and cause toxins in the water that harm fish and other living animals. This studied found that red tide can have a lingering effect on marine animals. It was found that the toxins can live in some animal life and plant life that the mammals feed on and then passing the lethal toxin to the mammal. This has been linked to high mortality rates for marine mammals.
Red Tide is caused by dinoflagellates, and cause toxins in the water that harm fish and other living animals. This studied found that red tide can have a lingering effect on marine animals. It was found that the toxins can live in some animal life and plant life that the mammals feed on and then passing the lethal toxin to the mammal. This has been linked to high mortality rates for marine mammals.
Monday, September 13, 2010
Hypsographic Curve
A Hypsographic Curve is a graph that shows the relationship between the depth of a body of water and the area that the water covers. First a person must find the area at each depth measured. This can be done by using a Bathymetric Map. Each depth of the map must be cut out then weighed on a scale, and the do the same with a square scale. From this, the area for each depth can be determined mathematically. Once the math is done, the data can be enter into an graphing program to get the curve. The depth should be on the y-axis and the area should be on x-axis. The area should also be at the top of the graph. This will then show you the slope of the bank under the water.
http://www.waterencyclopedia.com/Oc-Po/Ocean-Floor-Bathymetry.html
http://www.waterencyclopedia.com/Oc-Po/Ocean-Floor-Bathymetry.html
Subscribe to:
Posts (Atom)


